Transforming Service Desk Management
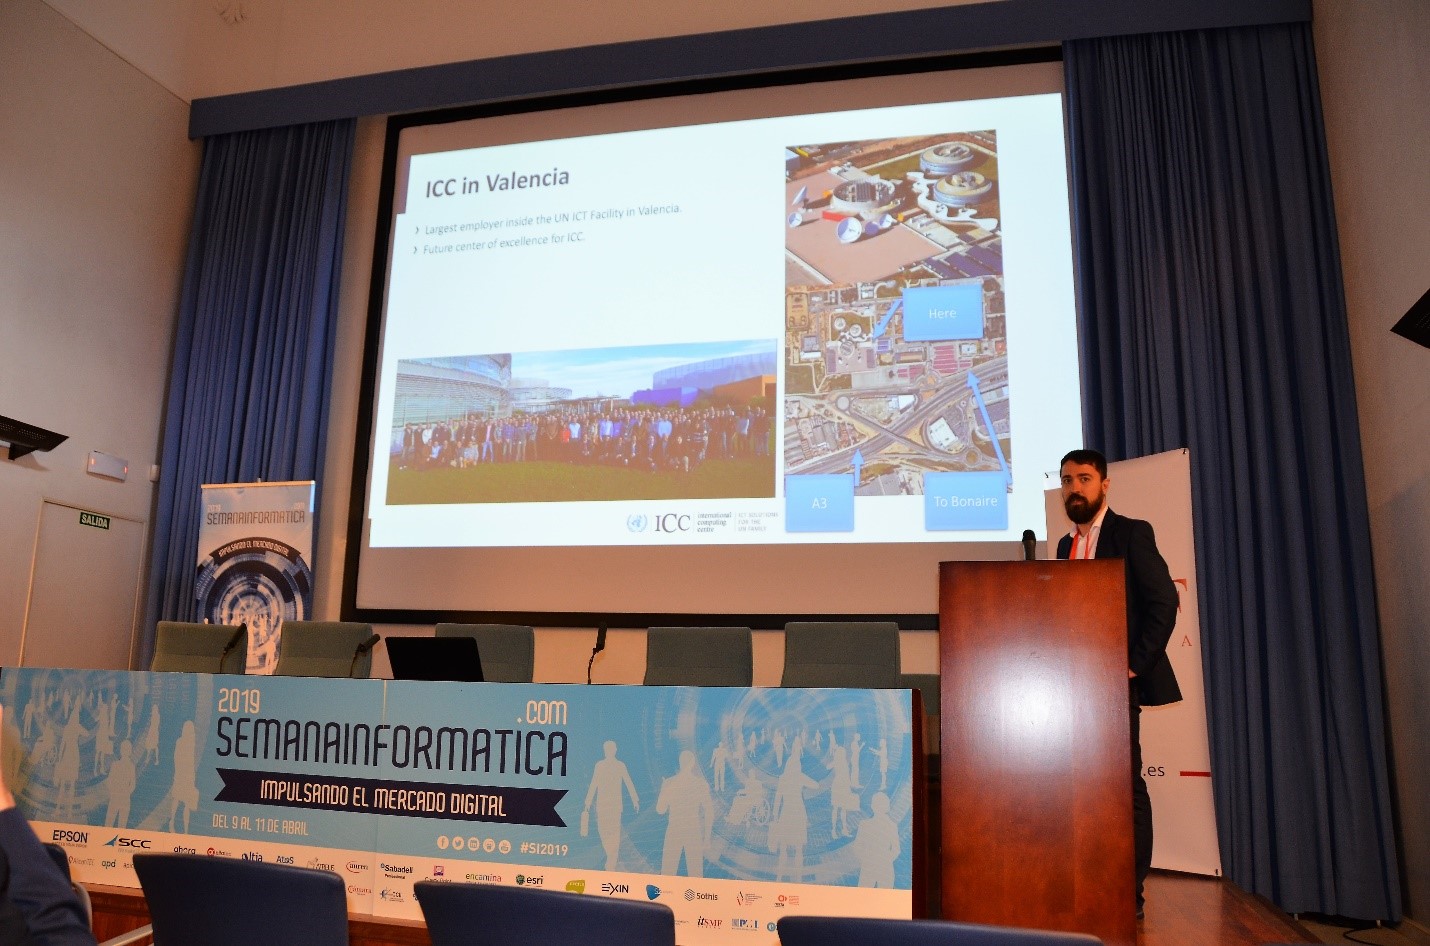
ICC Shared Services Service Desk team members presented 10 April 2019 to the IT Service Management Forum at Semana Informatica (IT Week) at the Computer Engineering Congress of Valencia, the most relevant IT event held in this region of Spain.
With the slogan Transforming IT Management, we presented a topic: how images can transform service delivery. We showed how during 2018 we changed service desk incident control task with data visualization and agile optimization tips.
We focused on making issues visible with data visualization, the methodology of Genba and using scrum techniques to innovate.
The gathered audience welcomed the presentation and at in the gala dinner the presence of ICC was mentioned as something both unexpected and positive. We received good feedback from organizations and many interested vendors looking for ways to collaborate with ICC.

Visual tools like YellowFinn help us to represent and digest better the information we need. If you have worked with ticketing system, you may have experienced this:

Or in a better way, this very same information:

We have gone through several transformations at the ICC Shared Services Service Desk in 2018, mainly using tools that were already there – tools that change the representation of the information in ways we can digest it better and act faster.
Back in early 2018 and earlier we used to rely on individual email notifications that were telling us which tickets should be closed, which ones should be pending, etc. For every update we were also receiving email notifications. In addition, we were receiving hourly notifications with the same information, and four times a day another summary email with extra quality checks. This situation had a big flaw:
- Hourly notifications were generated with 15 minute delays on the refresh
- Summary emails (4 times a day) had a delay of 30 minutes
- Scripts generating the emails had issues capturing certain types of updates.
Doing the follow-ups felt like this:

On top of that, we were missing our OLA targets, every month, which led to technicians spending additional time doing analyzing the breaches.

The problem reported in the analysis? It was most of the time the same: low performance with missed targets. The way we were working was far from ideal.
Making Issues Visible with Genba: Learn, Break (and Adapt)
We thought to apply a methodology for improvement, called Genba. In lean manufacturing, the Japanese idea of Genba is that problems are visible, and the best improvement ideas will come from going to the actual place, the Genba. This exercise takes management to the front lines to look for waste and opportunities to practice Genba kaizen, or practical shop floor improvement. Fundamentally this includes:
- Experiencing the work like any technician
- Finding areas for improvement
- Agreeing the actions with the team
- Implementing the actions.
So I tried it. I experienced the job as it was, I did the steps technicians were doing, and I asked a silly question, the silliest you could imagine: Are you aware of our OLAS? The answer was shocking, most of the technicians were not aware; others had a mistaken idea. The first action to solve our problem with the OLAS was clear: explain them. This also helped to understand the “why” of many things.
Second was to design something with the tools that we had to prevent the issues caused by other tools, and we came up with this:


This dashboard [how did you build it and with what toolset?] was an enabler of many conversations, and suddenly the team was asking to add features, “can you add a priority?», «can you add the summary here and there?”. The improvement was visible in our OLAS:
Only one OLA in breach, from the moment we started with the visual improvements and that is considering 95% compliance.
We achieved our OLAS; we had something working and helping the team to achieve the goals, now what?
We asked, using the concept of Genba – how is our workload? Are we extremely busy? Is the workload well balanced across our technicians? These questions were common; also, the issue of technicians saying the performance of a colleague was low… If the activity was visible to everyone, why do we hide it? If the workload is known and felt by everyone, why don’t we display it?
After several iterations, we came up with this:

Now we were able to understand where the workload was coming from changes, incidents, requests… we could clearly see the valleys in the weekends, and the team distribution.
Now the conversation drifted, this helped to reveal elephants in the room that previously were avoided, especially with regards to the individual performance.
Innovate with Scrum
My background is tied to software development, and I fell in love with scrum when I started practicing agile development using scrum. There was an inherent beauty in the way scrum could shape our interactions. Scrum, like agile development methodology, is a framework where people can address complex adaptive problems and productively, creatively deliver products of the highest possible value in significantly shortened timeframes.
I missed those interactions at our Service Desk. Even though we were doing team retrospectives, the interaction was not happening in a smooth way and some topics were difficult to address.
I was lucky that a colleague (Maria Camacho) took recently scrum training, and then the magic happened. She had the brilliant idea of using images to facilitate human interaction.
A starfish diagram. It was first explained to the team, demonstrated, and then left for a week. People came with their ideas, during a week new post-it notes were added, not in a category, but to be there and discussed later.
Then, the retro day came, and the team all posted ideas one by one. Some of the topics never came up before this and now we were discussing them. Not only it was enabling non-visible topics, the topics came naturally and with no pains. Yet we are to improve using this, we need to be more constant and open.
All in All
Transformation is a journey in which small changes can lead to great improvements. We have experimented with it, and I hope we can keep this momentum and experimenting changes that have a positive impact.
It is not only technology that help services improve, it is the full understanding of the why we are doing things, the research of the options to solve them, and having the team involvement in it.
It is so basic -and complex at the same time- as applying lean principles of asking the technicians running the processes to understand how improvements can be achieved, or experiment the processes and tools ourselves so we know the aches they cause.
At the very end, we did not change any tool sets. We used the things that were already there, just in a way that we could make the most of them. But we did change many mindsets. Visualizing our issues, our pain points and our opportunities made all the difference.


